Critical
Path Analysis:
A
Planning/Time Management Tool for Managing Research
By
Roger Hiemstra
October,
2000
Abstract
This paper urges use of Critical Path
Analysis (CPA) in formulating, scheduling, and managing the various milestones
or activities involved in a research or any other type of project that requires
advanced and careful planning. CPA involves the careful delineation and
sequencing of such activities, determining the time necessary to complete them,
and computing a critical path of activities around which the project must be
managed for success. As a researcher or planner you are shown how to carry out
each step in the CPA process through a series of visuals and corresponding
narration. The calendar dating of a CPA network, utilization of Gantt charts,
and other time management ideas are included.
What is Critical Path Analysis?
Critical Path Analysis can be defined as the
logical sequencing of a series of events necessary for a successful research
project in such a manner that the most efficient route to some culmination
point can be calculated. Consequently, the critical path technique has a
multitude of uses: (a) As an aid in time management, (b) as a provider of
ongoing data for assessing progress, and (c) to give the researcher or program
planner considerable information for decision-making.
CPA is a useful planning and management tool
for several reasons:
1.
A thorough identification of all major activities requiring
time and resources must be made during the planning process.
2.
Logical sequencing of these activities must be made.
3.
The time required for each activity must be estimated or
determined.
4.
The overall research or planning project is scheduled
according to the estimated times, resulting in a determination of the most
efficient plan for carrying out the various activities.
5.
Continuous evaluation of the planning and implementation
progress according to a predetermined schedule is required so necessary
decision-making for maintaining a schedule can be made.
Carrying out the above steps provides you
with an empirically constructed schedule of research or planning activities to
meet some self-imposed or institutionally required calendar of events. CPA also
provides you with a visual picture through the development of a model network
displaying how all research or planning functions tie together. The
availability of computer software related to CPA techniques even means that
information regarding progress in the planning and implementation process is
available as often as you input related data.
How CPA is Utilized
Learning how to utilize CPA means
understanding a few basic principles, procedures, and definitions. The
terminology and process to be described in the following narration and visuals
are somewhat unique to the CPA technique. Once these procedures are mastered,
you will find them applicable to any type of planning or time management need.
Step One: List the Major Activities
The procedure begins by listing all the known
or expected major activities to be undertaken in planning and managing a
research or other type of project. The level of detail or finiteness of the
activities will depend on your determination of their importance or
"criticalness" to completing your project planning and management according
to various time constraints. Over time in using CPA, whether by hand or by
computer, you will "learn" how detailed you need to be for success in
using the technique as a time management tool.
Listing the major activities requires a
thorough analysis of the steps involved in initiating, implementing, and
bringing to culmination a successful research or planning endeavor. Several
activities are described below. The examples used relate to planning a
conference or meeting to provide a common reference point for those not yet
familiar with necessary research steps. It should be obvious there could be
many variations or each activity could be divided into several smaller
activities for the examples shown:
A.
Formulating the meeting objectives
B.
Selecting a meeting planning committee
C.
Finalizing meeting site arrangements
D.
Developing the meeting program
E.
Advertizing/marketing the meeting
F.
Obtaining meeting speakers
G.
Making food and hotel arrangements
H.
Arranging for displays and exhibits
I.
Determining the meeting room needs
J.
Establishing registration procedures
K.
Finalizing the meeting program booklet
L.
Finalizing meeting evaluation procedures
M. Managing the
meeting logistics
N.
Tabulating meeting evaluation results
O.
Writing a final report
Step Two: Sequence the Major Activities
The next step is to sequence each activity
into a logical order based on when it must or is most likely to occur. The
sequence you select will be peculiar to your research or planning project, but
certain activities logically precede others (for example, in planning some type
of meeting formulating objectives almost always takes place before you obtain
the meeting speakers). This step usually requires some reshuffling of
activities before the final sequence is determined. Experience with planning
and the CPA technique will facilitate this sequencing step.
Step Three: Construct an Activity Flow
Diagram
In the third step you construct a schematic
or flow diagram detailing the sequence of activities determined for an overall
planning effort or research project. This step requires an understanding of
three basic definitions:
- Event - the start or completion
point of a meeting task or activity. Events do not consume time or
resources but are used as notations in constructing a CPA network.
- Activity - the performance of
an actual meeting task or activity. Activities do consume time and/or
resources.
- Network - the flow diagram
constructed by connecting events; this details the sequence of activities
for a particular meeting.
Figure 1 illustrates a simulated CPA network.
It is important to reemphasize that events (typically represented by circles or
squares in a network) do not consume time or resources, but merely are
beginning or ending points of actual planning and management activities. They
are usually identified by words within the circles or the circles are numbered
and defined elsewhere. Activities are the arrows connecting various events.
They are typically represented by capital letters shown on or near the arrows.
Each activity can be defined in a footnote to the network or on a separate page
if necessary for clarity's sake or if the network is to be part of a formal
meeting or research plan (e.g., activity "A" could be defined as
formulating the meeting objectives). Arrows made up of dashes or arrows
identified with the word "Dummy" represent dummy activities, those
activities requiring no time or resources.
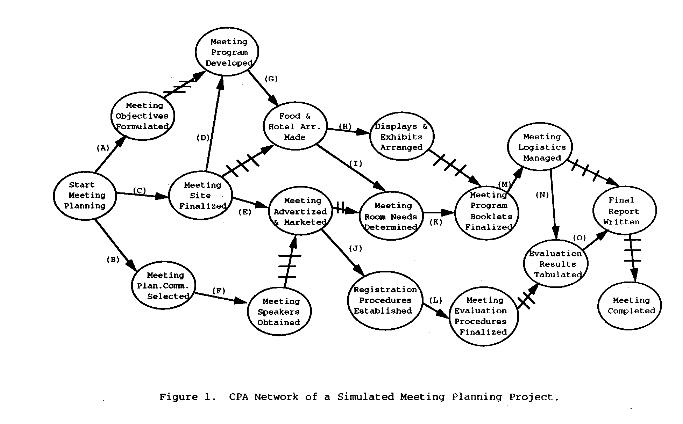
Arrowheads indicate the flow direction (e.g.,
"finalizing the meeting site arrangements" must take place before
"advertizing and marketing the meeting"). More than one arrow leading
to or from an event indicates that more than one activity is occurring at the
same time. In addition, it should be noted that the length of an arrow has no
relationship to the amount of time; arrows merely serve as connectors between
events and show the direction of the flow. See the following footnote for
explanatory information on a short cut method of displaying activity paths by
"assuming away" dummy activity arrows.

Step Four: Estimating the Time for an
Activity
The next step involves estimating the time
required to perform each activity. Time is usually represented on most networks
in days or in weeks. In the CPA process it is recommended you estimate the time
required for each activity utilizing as guides such criteria as experience,
suggested time requirements made by colleagues or planning authorities,
and known limitations of staff, resources, and money. A thoroughly constructed
network might even have defined how many people and who will be working on a
given calendar day, although there will be occasions when approximations will
be just as useful.
Figure 2 displays the previously constructed
network with time estimates included. They typically are displayed as numbers
on an activity arrow. The time estimates are simulated for this example and
they will always be specific to any single planning project, although
similarities will occur from project to project. They are used here primarily
to facilitate an explanation of the CPA technique.
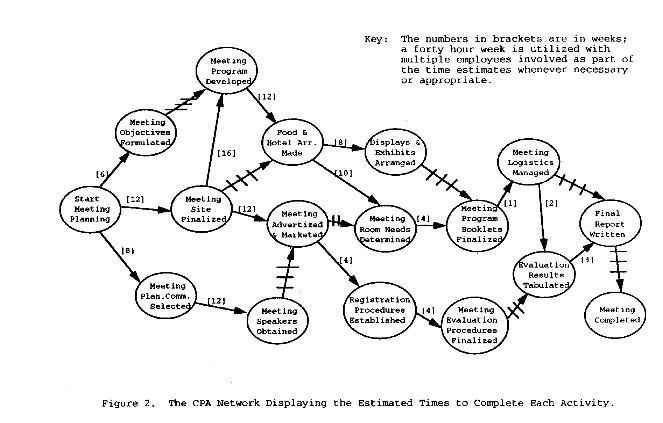
The simulated network utilizes 8-hour working
days and a seven day week, assuming that weekends and overtime costs need to be
computed if a dollar figure is attached to the network and any corresponding
time requirements of salaried personnel are considered in overall management of
whatever project being considered. In addition, concurrent activities will
require consideration of time needs in relation to the availability of total
staff and resources.
Step Five: Computing the Expected Times to
Complete All Activities
Following an estimation or determination of
the time required for each activity, the planner needs to calculate totals or
the earliest possible time that each event can be reached. Symbolized on Figure
3 by the letter "T," this total is derived by summing the estimated
times of all activity paths leading to any particular event.
As Figure 3 shows, times have been calculated
for all events in the example. They are shown at the top of the corresponding
event.
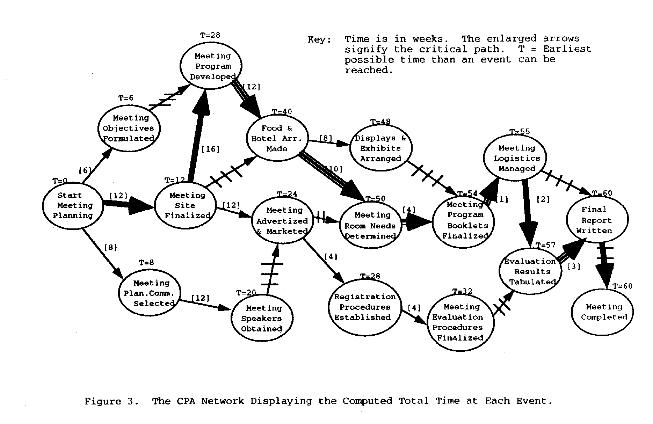
Step Six: Determining the Critical Path
A critical path, or that path of activities
that must be completed within the times shown if the entire plan is to stay on
schedule, can now be determined. Symbolized on the network by small
perpendicular lines or hash marks, the critical path is found by selecting
those activity paths requiring the most time to arrive at any one event. In
other words, to arrive at the "Conference Room Needs Determined"
event from the "Conference Site Finalized" event, it requires more
time to complete activity D (see Figure 1), then activity G, and then activity
I, than to complete either of the other two paths. More discussion of the
critical path and its usefulness is in a later section.
Two concepts must be understood before this
step can be achieved successfully. First dummy activities (represented on the
network simulated in this paper as lines that contain dashes) to not consume
time. They merely are logical connectors between two events. In other words,
the meeting planner cannot declare the overall meeting completed until the
final report is written, but immediately upon that task the meeting can be
declared as completed. As a further illustration, a dummy arrow might have been
drawn from the "Meeting Site Finalized" event to the "Meeting
Program Developed" event. In this case, that event would not take place
until all activities related to both formulating objectives and finalizing the
meeting site had been completed. Thus, when summing up times to a certain
event, the dummy activity times are assumed to be zero.
Secondly, time totals up to any event are
based on the earliest possible time that event can be reached. Thus, as all
activities leading to an event (more than one arrow) must be completed before
it is considered reached, the activity path actually taking the most amount of
time to an event is determined by adding all activities on the critical path.
For example, as shown in Figure 3 finalizing the meeting site, developing the
meeting program, arranging for food and hotel, determining the meeting room
needs, finalizing the meeting booklet, managing the logistics, tabulating the
evaluation results, and writing the final report represent the longest path,
the earliest possible time, and the critical path. No other activity paths
would take longer; thus the "conference completed" event is reached
in the earliest possible time of 60 weeks.
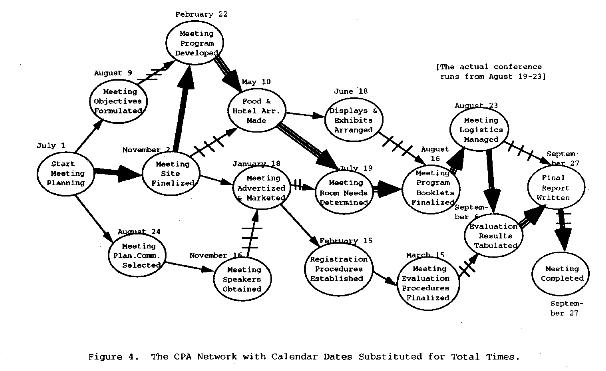
Step Seven: Constructing a Gantt Chart
Once all of the totals have been reached, the
planner can make the first application of the CPA process. Simply by starting
at the first event with some selected or mandatory calendar date, completion
dates at each even based on the corresponding totals can be established. Figure
4 shows the simulated network with appropriate calendar dates superimposed
based on a July 1 starting date. A critical path also is superimposed
(represented on the network by double arrows) to provide you with a visible
reminder of what is required to keep on schedule (as will Gantt charts--see
Figure 5).
It also has been the experience of many
planners that a corresponding "Gantt" chart (see Figure 5) can be
useful in quickly and constantly assessing a project's progress. (Henry Gantt,
a management pioneer, introduced the bar graph concept many years ago. It is
simply another way of displaying graphically the activities that comprise a
planning or research project.) This bar graph approach reveals how many
activities are taking place at once, when one activity must begin in relation
to another, and how long various activities are in progress. In essence, you
take each activity on the network, stretch the length to the appropriate
calendar length, and place it on the graph. You can even color code the
critical path as a quick visual reminder of what is crucial for staying on
time. Appropriate decisions to add resources or to have staff members work on
other activities can be made from these types of information if certain
activities crucial to keeping on schedule begin taking longer than expected.
Most computerized programs are capable of making Gantt charts. Here is a sample
of another Gantt
chart.

CPA and Decision-Making
The ability to make appropriate planning and
managing decisions based on the CPA process, in addition to its scheduling
usefulness, can be enhanced by adding two final steps to the process. These
steps are crucial if you find that the initially constructed network requires
more days or weeks than you had originally estimated or if the final completion
date must be moved up for some reason. Information is available that allows you
to make the most sound decisions regarding where to apply additional resources
in order to meet such needs.
The first of these additional steps begins by
establishing what is that final finishing date or allowable completion time. In
Figure 6 it has been assumed that 60 weeks is an acceptable time frame and that
it will allow you to run the meeting as scheduled. Then "L" (latest
allowable time) is set equal to 60 weeks at the "meeting completed"
event. On the network all "L" times are shown at the bottom of the
corresponding event (Figure 7 converts these to slack times)

To calculate the "L" times for all events
on the network, you must work backwards starting from the "meeting
completed" event, subtracting the appropriate activity times. For example,
as the meeting completion activity (closing accounts, storing evaluation data,
writing the final report, etc.) was approximated to require three weeks, the
latest allowable time at the "evaluation results tabulated" activity
is 57 weeks. This process is repeated throughout the network.
It needs to be emphasized that when more than
one activity path leads backward from an event, the activity path requiring the
most time to complete is the one whose time is subtracted from the
"L" time up to that point. This is demonstrated on the network, for
example, in calculating the latest allowable time for the "food and hotel
arrangements made" event. Although the smallest "L" times are
the dummy activity from "meeting program booklets finalized" back to
"displays and exhibits arranged" and activity H, it will require
considerably more time to complete activities K and I, the activities leading
backwards from "meeting program booklets finalized" through
"conference room needs determined" to "food and hotel
arrangements made." The corresponding subtractions (54 - 0 - 8 = 46 -vs-
54 - 4 - 10 = 40) show that the smallest "L" time is equal to 40.
Following this procedure the appropriate "L" times at each even can
be calculated.
The next and final step begins by determining
a "slack" time at each event. Slack time is defined as the amount of
excess time available to reach any particular event. Another way of looking at
this is that slack is the number of weeks the latest allowable time (L) exceeds
the earliest possible time (T) an event can be reached. It is determined by
subtracting the "T" time from the "L" time at each event. Figure
7 details the network with all the slack (S) times shown above the
corresponding event. This should not be confused with the various "T"
times previously displayed above the corresponding events in Figure 3. If you
were to have all the various times calculated via a computerized program, the
results typically are displayed in columns under appropriate headings rather
than superimposing them all on a single, and therefore most likely, congested
looking network.
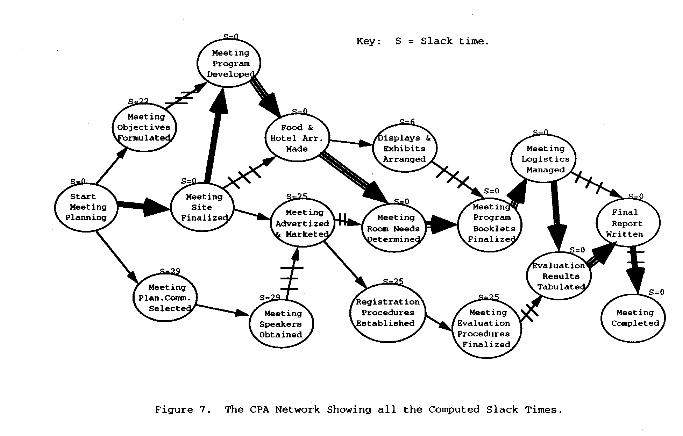
In explanation of the slack times, a value
greater than zero indicates that there are that many weeks of spare time in
terms of completing that event. The "slack" time concept also can be
used advantageously when the required completion or contract time is equivalent
to that determined in the original calculations. Those events with the least
amount of slack (usually zero if the "L" times and "T"
times are set as equivalent to each other--there are times when the number
could be minus if the "L" time was required by law or some other
reason to be set at a certain date and that date was prior to the calculated
"T" time) will always lie on the critical path, thus facilitating the
path's determination.
In addition, by setting the final event's
"L" time equal to the final "T" time and computing all the
slack times, the planner can identify those events where excess amounts of
slack time exist. Thus, if at any point the overall plan falls behind schedule,
the planner can divert staff time from activities not on the critical path to
those more critical activities and often thereby restore the plan to its
original schedule. Thus, in the simulated example if the overall project fell
behind schedule before the meeting room needs had been determined, those people
working on such activities as marketing and advertising or obtaining the
meeting speakers could be asked to pitch in for awhile on something like
developing the meeting program or making food and hotel arrangements.
Of course, once any event either is reached
early or late, the remaining network must be recalculated with new calendar
dates. For example completing any one of the activities on the critical path
might be shortened by one or more weeks by such actions as asking people to
work overtime, jobbing something out to another organization, or hiring
temporary people. Note, too, that the critical path always passes through those
events showing the least amount of slack, although there sometimes can be more
than one critical path when the slack times are equivalent on two different
paths leading to a certain event or the final completion event.
This type of information should aid you in
making a variety of decisions. If the research or planning project is faced in
the beginning with negative slack on the critical path because of some forced
contractual obligation (such as a college requiring the completion of a thesis
by a certain date in order to graduate), then you will know immediately that
some changes will be required in order to meet the required schedule. You also
will know where the most critical of these changes are needed. Available staff
or resources from those events with surplus slack time might be shifted to more
critical activities, new resources or staff assistance may be required to speed
up certain activities, or you may need to decide to eliminate or greatly reduce
certain activities.
The CPA procedure should facilitate most
planning and research projects. It forces you as planner to organize and
sequence the required activities carefully. Information also is provided that
will enable a calendar of meeting events to be constructed. The Gantt chart,
especially if reproduced in a very large format or displayed electronically for
those used to computer networks, can serve as a major discussion point at staff
meeting for determining progress or staff assignments. Finally, for the
individual research or meeting planner the CPA network or Gantt chart can
serve as a daily planner or self-disciplining tool to facilitate day to day
meeting management actions.
TIME MANAGEMENT/CRITICAL PATH ANALYSIS
Practice Activities
I. Preparation
A. Read the material above pertaining to
Critical Path Analysis (CPA).
B. Utilizing the "Energy Conference"
or "Professor See" examples below, or some planning need of your own
choosing, construct a CPA flow diagram.
1. Estimate the times and derive the most
efficient network.
2. Determine the slack areas and the critical
path.
3. Construct a corresponding Gantt Chart.
II. Educational Goals for this Activity
A. That you understand how to complete a CPA
network and Gantt Chart.
B. That you obtain experience in utilizing the
CPA planning approach.
C. That you develop your skills in time
management, time estimation, and explication of the steps necessary in
planning, managing, and/or evaluating a short-term meeting or some other type
of program.
Energy Conference Example
You are a conference planner for
the Nebraska State University (NSU) Extension Service. Your Dean has asked you to plan next year's
conference of the Missouri Valley Association of Teachers of Environmental
Science (MVATES) to be held on campus.
MVATES has an executive board that will take charge of selecting all
speakers and paper presenters and that will provide MC's or moderators for all
general sessions. You have approximately
14 months before the start of the conference.
Given the normal expectations
for NSU conference planners, you will be in charge of all logistics, conference
design, evaluation, and financial management activities. In addition, for this particular conference
you will be expected to liaison with the executive board and find moderators
for paper sessions from among local or State of Nebraska MVATES members. You also have at your disposal the normal
support staff from the Extension Service team.
As is normal, you will need to develop a budget but clear it through the
Extension Service's fiscal officer and the Dean. As always, you will be expected to clear an
approximate 10% profit above the expenses.
INSTRUCTIONS:
You are asked to think about
the major events and activities associated with planning and managing the above
short-term meeting. You should come up
with at least 15 such events and activities.
Remember that you will most likely determine different activities to be
accomplished for successful completion of the project than would someone else. Complete steps one through eight of the CPA
process
Professor See Example
Professor A. B. See of Siwash
University (known as the Big Blue) has been asked by his president (a beloved
individual) to make a survey of faculty attitudes toward the parking situation
on campus (a B I G problem). When the
survey has been completed, he is to turn in a written report of his findings to
the beloved president's office.
Professor See has decided to employ the CPA technique for managing this
little research project.
He decides to design a
questionnaire to survey the attitudes and to try out this questionnaire in
advance for securing revising ideas.
While Professor See has secretarial services, he does not have any
facilities in his office for laying out the questionnaire. Arrangements will have to be made for this
work to be done elsewhere on campus.
Since Professor See is a good
researcher, he also wants to develop an adequate sample design. He recognizes that both a tryout sample as
well as a final sample to whom the instrument will be administered will have to
be selected.
Since the faculty is quite
large, he anticipates sampling at least 500 people. He has been allotted money for having the
instruments processed. After the data
are entered they will be summarized by the computer center. However, as the data analysis is dependent on
a good coding system he develops that as the instruments are being
completed. After the data are summarized
he will analyze the results.
While waiting for data analysis
to be completed he prepares some parts of the final report dealing with the
purpose and data collection procedures.
Then when he has all the analyses he completes the final report for
submission to the president's office.
INSTRUCTIONS:
You are asked to study
carefully the above project description and to identify those activities which
you feel constitute the major tasks of the project. Keep in mind that you will most likely
determine different activities to be accomplished for successful completion of the
project than would someone else.
Complete steps one through eight of the CPA process.
____________________
Created January 1, 2009
Return to the planning page.
Return to the home page.